Performance
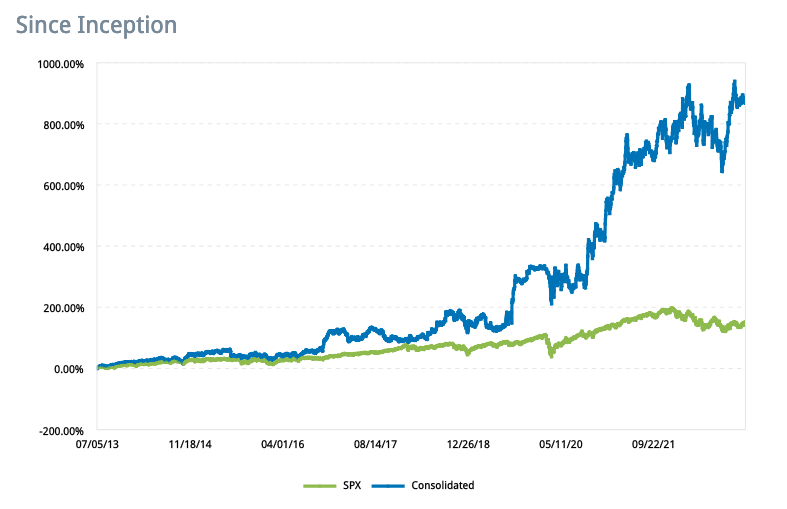
Compounded Annual Growth Rate: 26.7% (Calcluated over 9.5 years)
Yearly Performance
| 2013 | 2014 | 2015 | 2016 | 2017 | 2018 | 2019 | 2020 | 2021 | 2022 | |
|---|---|---|---|---|---|---|---|---|---|---|
| S&P 500 | 29.60% | 11.39% | -0.73% | 9.54% | 19.42% | -6.24% | 28.88% | 16.26% | 28.71% | -18.11% |
| CleverInvesting | 21.89% | 20.82% | -3.39% | 50.49% | -10.95% | 34.02% | 66.86% | 23.52% | 61.96% | 13.19% |
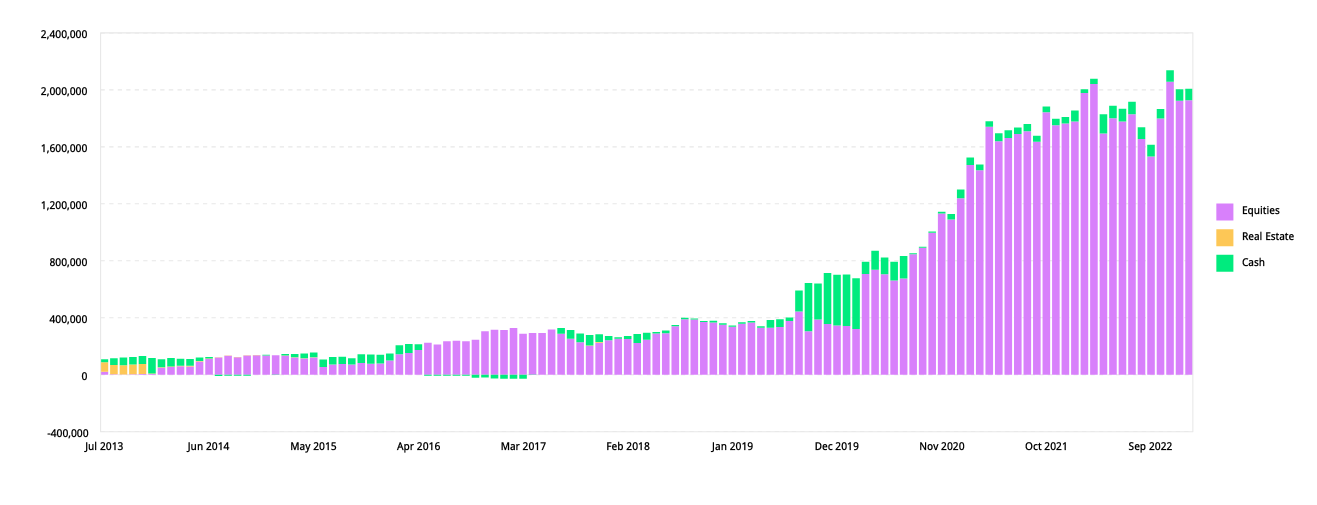
Allocation by Asset Type
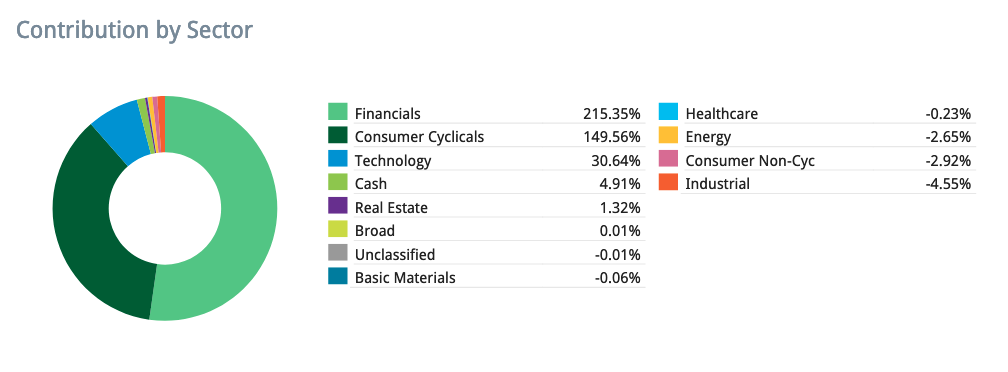
Performance Contribution By Sector
Definitions
The above performance graph and cumulative return were generated using Interactive Brokers Portfolio Analyst tool. The report consolidates the performance of all accounts under the management of CleverInvesting into a single report, using Time Weighted Return (TWR). TWR measures the percent return produced over time independent of contributions or withdrawals. TWR eliminates the impact of the timing of inflows and outflows and isolates the portion of a portfolio’s return that is attributable solely to the account’s actions. The performance of all accounts under management (Consolidated) is compared with the performance of the S&P 500 Index (SPX).
The Compounded Annual Growth Rate (CAGR) was calculated by hand, using the following input data from the Interactive Brokers Report:
- Cumulative Return: 867.11%
- Start Date: 2013-07-05
- End Date: 2023-01-30
- Number of days during period: 3,496
CAGR = 0.2673 = (1 + 8.6711)^(1 / (3496 / 365)) - 1
NOTE: Yearly performance for 2013 is a partial year, and is calculated using a time-weighted return.